Posts

Showing posts with the label Data Visualization

Visualizing Social Network - Part 2

Image
In Part 1, I wrote mostly about how I ended up working in SNA and I touched a bit on how Gephi can be used as the simplest solution to visualize your network. If you're good in JavaScript - the source generated by Gephi would've given you some idea on how to expand it further to have more selection panels and filtering capabilities. Unfortunately for yours truly - I suck at it.  Of course while I could spend some of my precious time learning a new language, I guess I could also make use of some ready-made tools available in the market. I chose Qlikview in this case. Mostly because it has a free personal license (who doesn't like free stuff right?)  Qlikview Traditionally - Qlikview doesn't support network graph visualization in any of it's out-of-the-box widgets. However, the beauty/strength of Qlikview in my opinion is it's support for extended plugins - which they call extensions. Using JavaScript, one has the ability to create any sor...
Information is Beautiful

Image
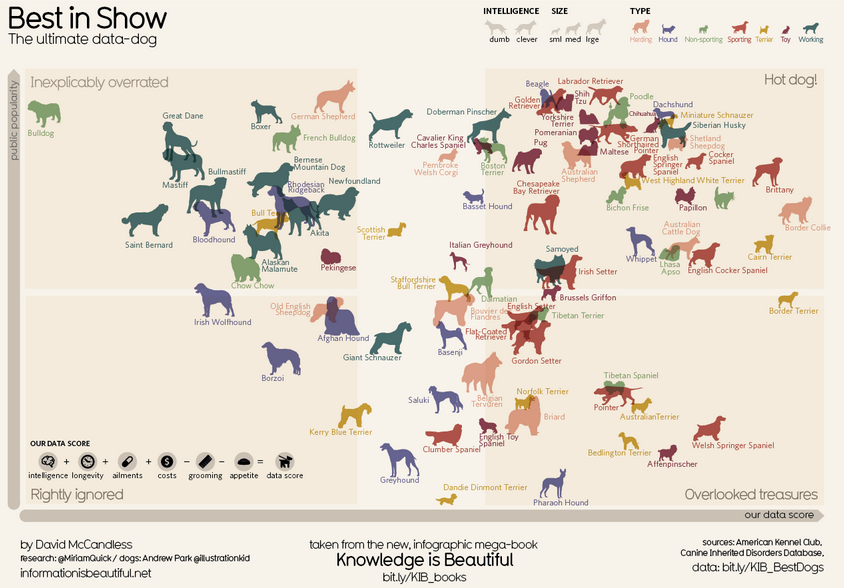
Taking a break from writing for today. However I did come across a few neat blogs on data science and data visualization. Of particular interest is Information is Beautiful . While they're not really doing a dashboard (only a few) or something interactive per se (most of the stuff in the blog are infographics), but I do like to see visually informative stuff from time to time and it's quite easy on the eyes. But just because it's not a dashboard or interactive does not mean that it can't be done! Sometimes all that people need are just some inspiration and off they go.

Visualizing Social Network - Part 1

Image
An idea is worthless unless implemented right? You can have all the data in the world but if you can't articulate it or visualize it for others to understand, then it's really just another data in your data warehouse. The last couple of months me and my colleagues were working on social network. Basically trying to understand how the subscribers are interconnected and identifying who are the influencers for targeted marketing - or so we thought that's how it should be. Business justification aside - it was an interesting topic to dive into. After a few days, we managed to come up with our edge and node list, and later ran a few centrality algorithms to measure each individual within that network. Specifically, we were measuring: Degree - The number of direct connections that one has. ie How many direct friends does he have? Closeness centrality - How close (by means of hop) is a person to each of the person in their network? Between-ness centrality -  Identifying w...